
How we secure Figma’s internal systems with agents




Our security team built an AI agent that triages alerts, conducts forensic investigations, queries our security data lake, writes code to fix issues—and remembers what it learns. Here's how we cut alert time-to-resolution by 71% and fundamentally changed how our on-call engineers work.
Share How we secure Figma’s internal systems with agents
Illustrations by Jimmy Simpson
When it comes to protecting our internal platforms, the threats we defend against on Figma’s security engineering team are shifting constantly. Cloud infrastructure changes frequently, developers adopt new tools, and what people install and run on their laptops is different every quarter (like when your Designer Advocates team starts vibe coding their own apps and automations The Figma MCP server reaches further across the platform than it ever has. From updating a living deck to shipping a design to production—here's what that looks like in practice.
4 ways we’re using our MCP server at Figma
Our SIEM, Panther, helps us keep ahead of all these threats by running a wide range of checks across our cloud infrastructure, endpoints, SaaS apps, and identity systems. When it detects a potential issue, it posts alerts into Slack and creates an Asana ticket for on-call engineers to pick up. Historically, being on call involved a massive amount of manual work. Gathering context was the main challenge. We’d have to figure out if the alert resembled something we’d just seen last week, if there was a pending PR that might address the issue, if Slack threads mentioned something related, and so on.
Like many teams, we saw LLM model capabilities rapidly accelerate over the past year. We recently shared how Figma stays ahead of vulnerabilities with agents For the past year, agents at Figma have guarded code as it's written, reviewed every pull request, and audited a decade-old monorepo, all on one policy.
How Figma stays ahead of vulnerabilities with agents
We started with a narrow goal of building a retrieval layer that could surface prior on-call engineer reasoning when a new alert fired. That project eventually grew into a full agentic system that investigates alerts, queries audit logs, writes code changes, opens PRs, and gets better over time through its own memory. It’s completely changed how our security team works.
The RAG layer: Giving alerts a memory
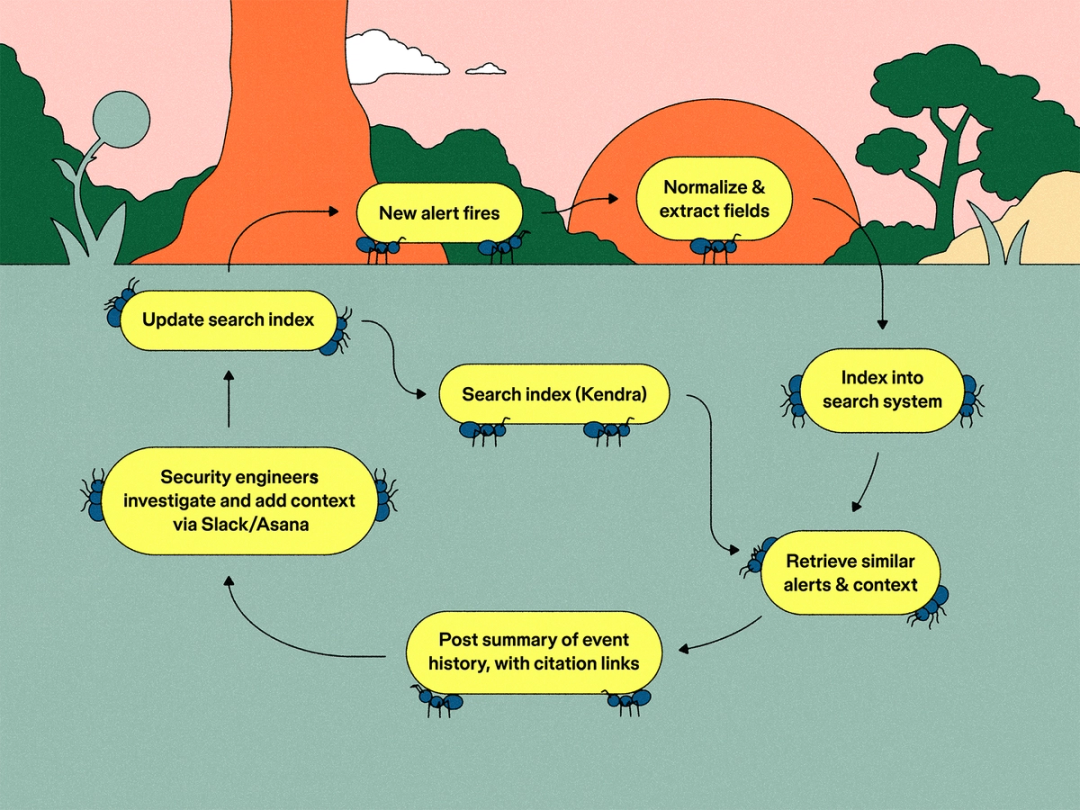
The first thing we built was a retrieval-augmented classification system on top of AWS Bedrock Knowledge Bases and Amazon Kendra. Again, our initial goal was just to surface historical context about what had happened the last time the same alert fired, and maybe suppress duplicate alerts.
When a Panther alert fires, our Lambda handler converts it into a standardized document and indexes it into Kendra. We pull structured fields out of the raw alert payload: IPs from p_any_ip_addresses, actors from p_any_usernames and various provider-specific user fields, AWS account IDs from ARNs. These become searchable Kendra document attributes alongside the alert title, severity, tags, and timestamps:
const attrs: DocumentAttribute[] = [
  { Key: 'alert_id', Value: { StringValue: doc.alert_id } },
  { Key: 'alert_type', Value: { StringValue: doc.alert_type } },
  { Key: 'severity', Value: { StringValue: doc.severity } },
  { Key: 'status', Value: { StringValue: doc.status } },
  { Key: 'created_at', Value: { DateValue: doc.created_at } },
  { Key: 'has_investigation_context', Value: { LongValue: doc.has_investigation_context } },
]
When the next similar alert fires, we query Bedrock for semantic matches using the alert title (which is typically the name of the detection followed by the actor username) as the primary vector:
function buildQueryFromAlert(alert: Alert): string {
  return `${alert.data.title}\n\nhas_investigation_context=1`
}
Another thing that improved the recommendations was biasing toward recent results. A similar alert from two days ago is way more useful than an exact duplicate alert from six months ago, because how we triage alerts is ever-evolving, too.
We bias toward retrieving alerts that have investigation_context, which are comments left by an on-call engineer in Slack about what they found. (A closed alert with no comments tells you almost nothing.) We capture investigation context without changing our engineers’ existing workflows. When someone leaves a note in a Slack alert thread (and we have a similar procedure for Asana tickets), we index that comment back into Kendra as investigation context on the original alert:
export async function addInvestigationContext(
  alertId: string, contextText: string
): Promise<void> {
  const existingDoc = await findAlertDocument(alertId)
  if (!existingDoc) return

  let updatedContext: string[]
  updatedContext = [...existingDoc.investigation_context, contextText]

  const updatedDoc: AlertDocument = {
    ...existingDoc,
    investigation_context: updatedContext,
    has_investigation_context: 1,
  }
  await reindexDocument(updatedDoc)
}
Every time someone writes a useful comment on an alert thread, they’re making every future similar alert cheaper to triage. We didn't need a special annotation tool or a training pipeline, because the existing workflow is the training pipeline.

What retrieval could do, and where it stopped
Our retrieval system generates and posts a summary (for human consumption) into Slack/Asana for each alert. This started helping our on-call burden almost immediately. Anecdotally we heard that it was cutting down on alert triage time, and it also let us make some programmatic changes to reduce alert fatigue. When we found similar alerts with a high confidence of being benign or duplicative, we’d automatically downgrade severity:
if (autoResolutionConfidence >= 7) {
  if (updatedSeverity === 'high' || updatedSeverity === 'critical') {
    await alertsDb.updateAlertSeverity(alert.alertId, 'medium')
  }
}
We saw a 20% drop in on-call pages from this change alone.
With our RAG system in place, we started thinking about what the next step would be, which seemed obvious: some kind of agentic layer to assist with alert investigation and resolve issues automatically.
Adding an agentic layer on top
We use Tines for workflow automation, and take advantage of its ability to run LLM agent loops with explicit tool interfaces: read a Slack thread, look up an Okta user, query Panther data, open a PR in a specific repository, etc. An engineer can look at the tool list and reason about what the agent can and can't do. When you're giving an automated system access to production security data, that auditability is worth a lot.
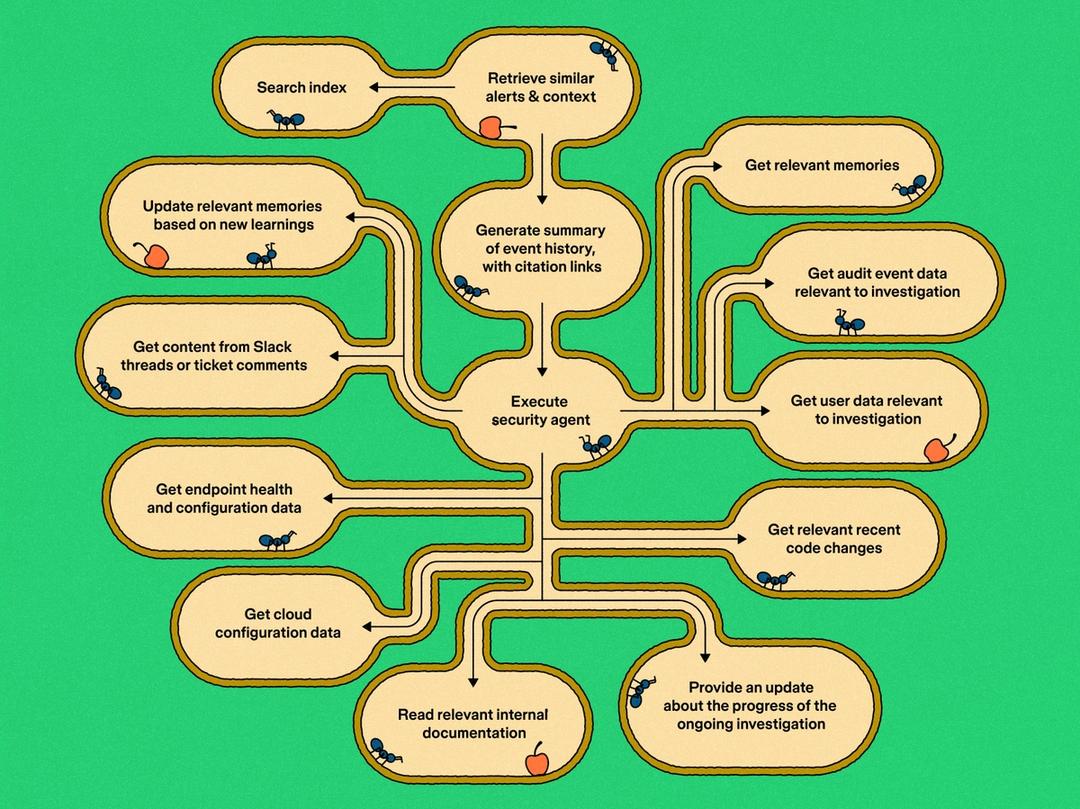
We used Tines to build an agentic layer on top of our RAG. When Panther detects an event, our Lambda stream handler posts the alert to Slack with the first-pass LLM summary and similar-alert references from the RAG layer, and then it auto-tags @Tines Security Slackbot in the thread. On-call engineers can also tag the bot manually in any thread to invoke it on demand to ask follow up questions or gain other specific insights as the situation may require.
When the bot is tagged, a webhook fires into Tines and the first thing that runs is intent routing. A more lightweight model (like Claude Sonnet) reads the full Slack thread and classifies the request: Is this alert triage, a platform security question, an app approval inquiry, or something else? Each classification routes to a specialized agent with its own scoped tool inventory, authorization layer, and system prompt. The alert triage agent handles the bulk of the work, but having separate agents for different intents means we can give each one a focused set of tools without the risk of a sprawling agent that has access to everything.

The alert triage agent’s toolkit
The alert triage agent (using a model like Claude Opus) is where most of the investigation happens. It receives the full Slack thread history as context, its own steering memory (more on this later), and a set of tools scoped to what a security on-call engineer typically needs during triage, including:
- Okta: get a user’s profile, list their groups, check login history, search for users by filter. When an alert fires about suspicious activity from a specific actor, the first thing the agent usually does is pull their Okta profile to understand who they are and what they’re supposed to have access to.
- North Pole Security Workshop (which manages our endpoint security tool, Santa): search rules, search events, check host sync status, push rules to hosts. If the alert involves a blocked binary or an endpoint policy violation, the agent can look up the signing ID, check event history for that binary, and see if other users are hitting the same block.

Rolling out Santa without freezing productivity: Tips from securing Figma’s fleet
We scaled Santa, an open-source binary authorization tool, across all Figmates’ laptops to boost endpoint security while keeping workflows seamless. Here’s how we tackled the challenges and ensured a smooth rollout.
- Wiz: pull audit logs, cloud resource inventory, vulnerability findings, open issues, and exposed resources. For cloud infrastructure alerts, the agent can check whether a flagged resource has known vulnerabilities or misconfigurations.
- Slack: read thread replies, look up user profiles, send progress updates. The agent reads prior threads that are linked from similar alerts to pull in past on-call engineer reasoning and related discussion.
- Panther: get alert details, get the raw events that triggered an alert, list related alerts. This gives the agent access to the structured alert payload beyond what was posted to Slack.
- Code modification: open PRs in our Panther detections repo or our monorepo. More on this later.
- The Panther investigation sub-agent: a separate LLM-powered agent that can write and execute Snowflake SQL against our full security data lake. This is the most powerful tool in the set, and we’ll talk about it next.
Querying the security data lake
The triage agent can answer a lot of questions with its direct tools: “Who is this user in Okta?”, “What Santa rules apply to this binary?”, “Is this cloud resource in Wiz?” But plenty of investigations need to go deeper. What was this user doing in AWS in the two hours before the alert? What processes were running on their endpoint and were those processes doing anything unusual? Did they access any other apps or make configuration changes during that window?
For those questions, the triage agent delegates to a separate investigation sub-agent. This sub-agent (also a model like Claude Opus) takes a natural-language query from the parent agent and translates it into Snowflake SQL. It runs against our Panther data warehouse, which ingests audit logs from across the company: AWS CloudTrail, Okta system logs, GitHub audit events, GCP audit logs, osquery endpoint telemetry, Workshop/Santa events, Wiz findings, and about a hundred other tables.
The parent agent calls it the way you’d ask a colleague to run a query: “Find the most recent Okta logins for user X in the past 48 hours” or “Check what processes user Y has been running on their endpoint over the last 2 days” or “What was user Z doing in AWS EKS between 10:21 and 20:21 UTC on March 10?” The sub-agent figures out which tables to hit, what columns to use, and how to filter by time.
This works, but the table schemas can be a bit messy. Column names are inconsistent across log sources, join keys aren't well documented, and the time-partitioning functions vary by table. Without help, the sub-agent would spend four or five queries just discovering the schema before it could answer the actual question. Or worse, query in a way that returns incorrect or incomplete results. We'll look at how we solved this in the memory section below.
Developing and segmenting agent memory
Memory ended up being the thing that had the most impact on how useful the system became over time. We have several kinds, and keeping them separate turned out to be important.
The RAG corpus is what we call case memory. It’s the system we already described: historical alerts plus investigation context from Slack and Asana. When the agent needs to know what similar situations looked like, or what an on-call engineer concluded about a past incident, this is where it looks.
On top of that, we have what we call steering memory. This is behavioral guidance for the agent, stored as a markdown document that gets loaded into the agent's context at the start of every run. Think of it like an For the past year, agents at Figma have guarded code as it's written, reviewed every pull request, and audited a decade-old monorepo, all on one policy.AGENTS.md file or the threat model an agent scanning the codebase for vulnerabilitiesHow Figma stays ahead of vulnerabilities with agents
resource-sync and group-sync jobs before concluding it's systemic” or “user X is doing maintenance on system Y this week, treat those alerts as expected.”
The agent can update its own steering memory when a security engineer corrects it. If someone says “you handled that wrong, here’s what you should do instead,” the correction persists for future runs. But we learned to be careful about what goes into steering memory versus what stays in the RAG layer. A one-off lesson about a specific alert type should go into investigation context so it surfaces as precedent for similar future alerts. A behavioral rule that should change how the agent approaches all alerts belongs in steering memory. One early mistake was saving everything as steering memory, which started overriding the agent’s behavior in unwanted ways. Precedent and policy are different things and they belong in different places.
We also use database-backed records in Tines for stateful objects: open PRs the agent has created, Panther investigation state, things that need stable keys and status tracking rather than natural-language retrieval. These are more mundane but necessary.
The most interesting memory layer is procedural, and it directly solves the schema discovery problem described above. We gave the investigation sub-agent its own memory store, organized by tags (aws, okta, osquery, workshop, etc.). Before starting a query, the agent loads relevant memories for the data sources it's about to hit. After completing an investigation that required schema discovery, it saves what it learned:
Title: Job Description Fields in Workiva Logs (2026-03-12T16:25:21 UTC)
Memory: Job descriptions for each user within the system can be found within the field 'jd' in the table 'WORKIVA_USERS'.
A second LLM (using a lighterweight model) handles the actual memory formatting: It takes the raw finding, generates a title with a UTC timestamp, tags it, and writes the memory. The first time we asked the investigation agent about Zoom activity, it needed multiple discovery queries. After it saved a memory, the same question cost a single query. That pattern repeated across data sources as the agent built its own operations manual through trial and error.
Examples of agent investigations
To illustrate how the agent works in practice, here are three recent examples.
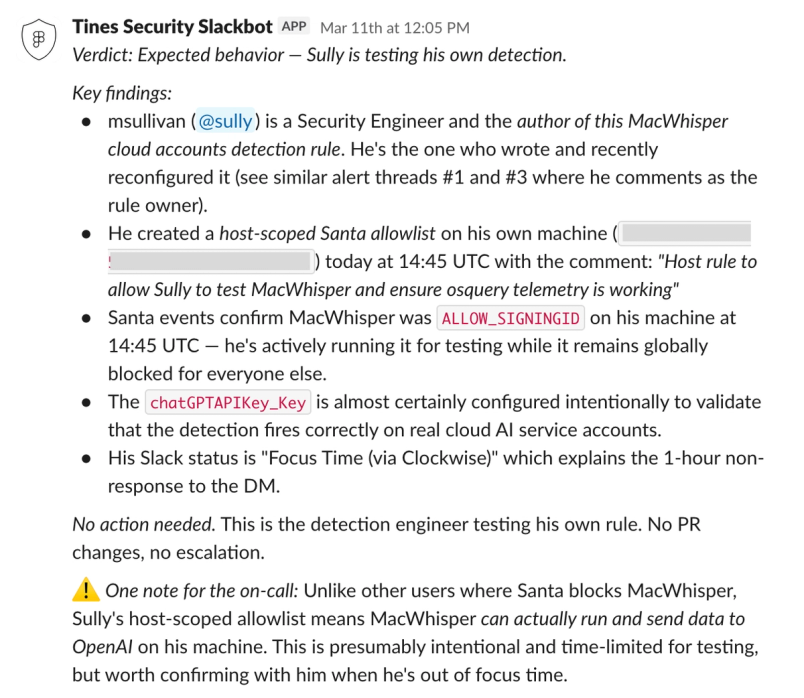
First, there’s the case of when an alert fired because someone installed a macOS audio transcription app that has not been reviewed and approved for use at Figma. The triage agent read the alert thread, pulled similar historical alerts from the RAG layer, and then used its Okta and Workshop tools to put the pieces together: The actor was the same engineer who had authored the detection rule—me, Matthew! Workshop showed a same-day, individually-scoped rule that had been created for testing. Conclusion: The rule author was testing his own detection. No action needed. The agent even made a note that, based on my Slack status, I was heads-down and it may be a bit before I could confirm my activities.

A different case: Repeated Snowflake alert pages kept firing for the same service account. The agent described the current state, delegated to the investigation sub-agent to query the relevant audit logs, identified why the alerts were recurring, found that a draft PR had already been opened to suppress them, and explained the longer-term fix that was under discussion in another thread. The on-call engineer got a complete picture without opening a single tab, something that was unfathomable just a few months ago.
Finally, we often fire alerts for situations that could be related to malware, but are most commonly quite legitimate behavior (e.g., an unknown launch service being installed on Figma MacBooks). In the past, this would have been unthinkable; our team supports thousands of Figmates, and we’d quickly be overwhelmed by the alert volume. However, in this new model, our agent can verify the binary is signed by a trusted entity, use the Panther query capability to figure out how it got installed (brew, App Store, etc.), and then automatically write up the necessary code changes to suppress the alert in known-safe conditions in the future—all without human intervention.
From investigation to code changes
The step that surprised us most, in terms of how much time it saves, is when the agent goes from “I’ve figured out what's going on” to "here's a PR that fixes it.”
There are two code paths. For changes to detection rules, allowlists, and alert suppressions, the agent opens PRs against our Panther detections repo. This is the common case: An alert keeps firing for a known-benign pattern, an on-call engineer confirms it's a false positive in the Slack thread, and the agent generates an allowlist entry or tunes the detection rule. For everything else, like infrastructure changes, service configs, Terraform, or RBAC and IdP configuration, the agent works against our monorepo.
Bot-authored PRs mean git blame points at a service account, which isn't helpful for understanding the context of a change months or years later. We now include the requesting security engineer's name in the PR description and link back to the originating Slack thread. We should have done this from the start.
If a reviewer leaves comments on the PR, the agent picks those up through a GitHub webhook and can make additional changes or respond. It can also rebase stale branches onto the latest master when PRs sit open for a while.
Guardrails
All tool calls include deterministic safeguards to ensure the agent isn’t trying to do something we don’t want it to do. For example, every PR the agent creates gets set to draft automatically. This is performed as a deterministic post-step in the Tines workflow, not as a prompt instruction, because we found early on that relying on the LLM to remember “always create as draft” wasn't reliable enough.
We use this type of tool-calling contract to enforce all sorts of controls deterministically, from ensuring the agent doesn’t receive or process sensitive employee information when retrieving Okta data, to guaranteeing that the agent doesn’t try to close or modify pull requests it didn’t author. Because the security of any system relies on having layered controls, we also take great care to ensure that the tools available to the agent are also properly scoped, authorized, and monitored, and that the agent itself is working on behalf of an authorized team member.
We’ve also tried to contain the consequences of bad context. The agent does not get ambient access to whole Slack channels, and outside of DMs, it can read a thread only when it’s been explicitly re-tagged on the latest message.
Finally, we’re much more comfortable with autonomy when the action is bounded, reversible, and supported by clear evidence than when it is broad, destructive, or difficult to audit. In practice, that means read-heavy investigation, duplicate detection, precedent retrieval, and draft remediation are better fits for agentic execution than generic high-powered write paths.
We expect a larger share of alerts to be handled automatically over time, but only behind tighter guardrails: narrower action scopes, better evaluation (like this example For the past year, agents at Figma have guarded code as it's written, reviewed every pull request, and audited a decade-old monorepo, all on one policy.How Figma stays ahead of vulnerabilities with agents
In hindsight
Here are a few things we’d do differently if we were starting from scratch:
- Procedural memory should have been there from the start. The investigation agent's self-built schema memory was a late addition, and the improvement was so dramatic that everything before it feels almost like wasted work in retrospect.
- Configuration-as-code is essential to keep the agent layer from fragmenting. Because team members want to iterate quickly, you end up with people making and operating slightly different copies of the same core agent with slightly different tool configurations, used for different purposes. As you might imagine, it becomes very hard to ensure all the tools available to these agents are consistent and work the same way. Today, our core set of tools is now configured and managed outside of any individual agent, in configuration-as-code, ensuring that all agents can benefit from a well-maintained, standardized set of actions.
- If you’re building an agent to integrate with Slack, the trust model for public channels deserves upfront thought. Our agents have authorization controls to ensure that only security team members can command them, but if an agent decides to go looking through detailed logs of user activity, all sorts of sensitive data could surface. Data describing a user’s activity that day is completely fine in a private security thread, but becomes a huge problem in a room with a hundred people. We handle this through channel-aware prompt design and other deterministic controls, but it's the kind of thing you want to design up front rather than bolt on later.
Where we are now, and what’s next
The system handles all initial security response work for the team. The on-call engineer's job shifted from "investigate from scratch" to “review what the agent found, confirm or correct, and handle the cases that need human judgment.”
We’ve seen around 70% reduction in time-to-resolution on complex alerts, 20% reduction in on-call pages through AI-driven severity downgrading, 25% fewer endpoint software approval requests (the agent detects when a user is asking about a tool and directs them to comparable approved alternatives), and meaningfully higher on-call engineer confidence in resolution quality because the agent’s evidence chain is explicit and reviewable.
A year from now, the system will have internalized thousands of triage decisions, schema mappings, and behavioral corrections that no one person on the team could hold in their head. That’s the thing we’re most optimistic about: not any single agent run, but the fact that every run makes the next one cheaper and more accurate.
A lot of the next phase is about building a better control plane around the model. We want sharper distinctions between our memory layers for precedent, policy, and state. We want better ways to decide when an alert is safe to auto-close versus when it should be escalated, even if the model sounds confident. And we want the workflows we trust most to graduate out of prompt behavior and into deterministic, inspectable automation.
A final note: There’s a lot of talk about whether it’s worth it to use AI to investigate issues, because AI isn’t perfect. But humans aren’t perfect either. We believe it’s not an either-or choice of humans or AI. Rather, there are many things you can do in between these two extremes to reduce risk and improve efficiency, and the playbook is still being written.
We're hiring engineers!
Learn more about life at Figma, and browse our open roles.
We’re excited and proud of what we’ve built, but we know this is just the beginning of a longer journey with an immense amount of promise and likely pitfalls. If other teams are building similar systems, please reach out! We’d love to compare notes.

Matthew Sullivan is on the Platform Security team at Figma, where he works on corporate and cloud security controls. Before Figma, Matt lead infrastructure and identity security at Instacart, where he managed the team responsible for cloud platform security controls across all three major cloud providers.
Brad Girardeau is a security engineering manager at Figma. He leads the Platform Security team, securing Figma's endpoint, developer, and cloud infrastructure.